2024-2 Numerical Weather Prediction
SUPERCELL
Instability
As the size of the supercell increases, atmospheric mixing becomes more efficient, leading to faster stabilization of the atmosphere. This indicates that larger supercells experience more intense vertical mixing, resulting in quicker resolution of atmospheric instability.
This is evidenced by higher CAPE, lower LI and SI values, and elevated TT index and dew point depression in larger supercells.
CAPE Analysis
Overview
CAPE is a critical measure of atmospheric instability, often used to evaluate the likelihood of powerful storms such as supercells. High CAPE values can lead to large-scale convective activity and strong updrafts.
-
CAPE > 900 J/kg: Moderate instability
-
CAPE > 1800 J/kg: High instability
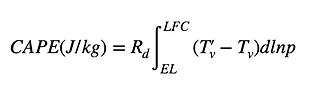
Rd: gas constant for dry air
T'v: virtual temperature of the rising air parcel
Tv: virtual temperature of the environmentIntegration from LFC (Level of Free Convection) to EL (Equilibrium Level)
Analysis
Initial CAPE Value and Forcing
The initial CAPE in the input sounding was set to approximately 2000J/kg, indicating moderate atmospheric instability. After applying initial forcing, buoyant forces triggered convective activity, which initiated strong updrafts in the atmosphere.
Time Evolution of CAPE
Over time, CAPE gradually decreases as the convective activity consumes the available energy, resulting in atmospheric stabilization. The reduction rate varies significantly based on the supercell's size.
Larger supercells show more rapid decrease in CAPE values, indicating more efficient vertical mixing and faster atmospheric stabilization.


Supercell Size Comparison
Larger supercells show faster CAPE reduction compared to smaller ones due to more efficient vertical mixing.
-
5km: Smaller supercells show slower CAPE reduction, indicating less efficient vertical mixing and more gradual stabilization of the atmosphere.
-
10km: Shows moderate rate of CAPE reduction, with intermediate mixing efficiency and atmospheric stabilization.
-
30km: Larger supercells experience rapid CAPE reduction due to enhanced vertical mixing, leading to faster atmospheric stabilization and more efficient convective processes.


Conclusion
Larger supercells experience more rapid CAPE reduction due to enhanced vertical mixing, leading to faster atmospheric stabilization. This relationship indicates that the increased size of a supercell results in more efficient mixing processes and quicker resolution of atmospheric instability. This suggests that while larger supercells may have stronger initial convection, they tend to stabilize more quickly due to more effective vertical mixing.
Skew T log P diagram
skew T-log P diagrams from 5km simulation at three time stages :

Key features in the Diagrams:
Larger supercells retain CAPE longer than smaller ones.
-
Red line: Environmental temperature profile
-
Green line: Dew point profile (indicates atmospheric moisture content)
-
Black line: Air parcel path (shows the trajectory of surface air rising through the atmosphere following dry and moist adiabats)
-
Red shaded area: CAPE (Convective Available Potential Energy) represents the positive buoyant energy available for convection - larger shaded areas indicate greater potential for strong updrafts and severe weather development
Analysis
Initial Sounding (input sounding)
-
Shows the input sounding with initial CAPE of 2000 J/kg
-
Indicates a highly unstable atmosphere with significant convective potential
Middle Stage Sounding (1hr sounding)
-
The dew point profile approaches the environmental temperature profile, indicating moistening in the low atmosphere where clouds are present
-
Latent heat release and vertical mixing modify the temperature structure
-
CAPE decreses as strong updrafts lead to cloud formation and atmospheric mixing, gradually stabilizing the unstable environment
Final Stage Sounding (2hr sounding)
-
Shows how the initial strong instability has been stabilizes through vertical mixing
-
A notable dry lager appears in the middle atmosphere
-
Demonstrates the complete evolution from unstavle to more stable condition
SI Analysis
Overview
Showalter Index (SI) is an indicator of atmospheric instability, commonly used in meteorology to assess the potential for thunderstorm development. SI values become more negative as atmospheric instability increases.
-
SI < 3: Indicates atmospheric instability
-
SI < -3: Indicates highly unstable conditions

T_500 is the actual temperature at 500 hPa level
T_L is the temperature that an air parcel would have if lifted from 850 hPa to 500 hPa
Analysis
Initial SI Value and Forcing
The initial SI value highlights the baseline instability within the supercell. The initial negative SI value suggests that the air parcels within the supercell are warmer than the surrounding atmosphere, promoting upward motion and convective activity. After applying forcing, convective activity increases as the air parcels continue to rise within the unstable environment of the supercell.
Time Evolution of SI
Over time, the SI value adjusts as convective processes lead to atmospheric stabilization, with the rate of stabilization varying by supercell size. Larger supercells show a faster transition to more positive SI values, indicating more efficient vertical mixing and faster stabilization of the atmosphere.
This enhanced mixing efficiency in larger supercells leads to quicker resolution of atmospheric instability, suggesting that while initial convection may be more intense, the atmosphere stabilizes more rapidly.


Supercell Size Comparison
-
5km: Smaller supercells show slower stabilization with SI values gradually returning to neutral, indicating less efficient vertical mixing.
-
10km: Shows intermediate rate of stabilization with moderate changes in SI values.
-
30km: Larger supercells demonstrate rapid changes in SI values towards neutral, indicating efficient vertical mixing and faster atmospheric stabilization.
Conclusion
Larger supercells show faster transition to neutral SI values due to enhanced vertical mixing efficiency. This relationship suggests that the increased size of a supercell leads to more effective mixing processes and quicker stabilization of the atmosphere.

TT Analysis
Overview
Total Totals Index (TT) is an indicator of atmospheric instability, used to assess the likelihood of thunderstorm development. Higher TT values indicate greater vertical instability, with potential for strong convection and severe thunderstorms.
-
TT > 54: Potential for thunderstorm
-
TT > 60: High likelihood of severe thunderstorm

T_850: temperature at 850 hPa level
T_500: temperature at 500 hPa level
D_850: dewpoint temperature at 850 hPa level
Analysis
Initial TT Value and Convective Potential
The initial TT value provides a baseline measure of instability. Higher TT values reflect warmer, buoyant air within the supercell, which promotes upward motion. After applying forcing, the buoyant air parcels initiate stronger convective activity, intensifying the instability indicated by TT.
Time Evolution of TT
As time progresses, TT values gradually decrease as convective processes consume the available energy. The rate of decrease varies significantly by supercell size.
Larger supercells show more rapid decrease in TT values, indicating more efficient vertical mixing and faster stabilization of the atmosphere.


Supercell Size Comparison
-
5km: Smaller supercells show slower decrease in TT values, indicating less efficient vertical mixing and gradual stabilization
-
10km: Shows moderate rate of TT value reduction, with intermediate mixing efficiency.
-
30km: Larger supercells experience rapid decrease in TT values, demonstrating enhanced vertical mixing and faster atmospheric stabilization.

Conclusion
Larger supercells exhibit faster reduction in TT values due to more efficient vertical mixing processes. This indicates that increased supercell size contributes to enhanced mixing efficiency and more rapid atmospheric stabilization.
Dew point depression (T - Td)
Overview
Dew point depression, the difference between air temperature(T) and dew point temperature(Td), is a crucial of atmospheric moisture content. Lower values indicate higher moisture content and potential for storm development.
-
T-Td < 4°C : Very moist atmosphere, high potential for precipitation
Analysis
Initial T-Td Values and Moisture Distribution
The initial T-Td distribution shows the baseline moisture content in the atmosphere. Areas with T-Td ≤ 4°C indicate regions of high moisture content, which are favorable for convective development. After the initial forcing, these moist regions begin to expand as the supercell develops.
Time Evolution of T-Td
As time progresses, the area with T-Td ≤ 4°C expands, indicating increasing moisture content in the atmosphere. The time series graph shows:
-
First 40 minutes: Minimal growth in moist areas for all sizes
-
80-160 minutes: Accelerating expansion of moist regions
-
Beyond 160 minutes: Rapid growth with clear size-dependent differences in expansion rate
Larger supercells maintain larger areas of low T-Td values, suggesting more extensive regions of high moisture content and greater potential for sustained convective activity.


Supercell Size Comparison
-
5km: Shows the smallest area of T-Td ≤ 4°C (~18,000 km² at peak), with more fragmented moisture distribution patterns
-
10km: Demonstrates moderate moisture area expansion (~23,000 km² at peak), with more coherent moisture patterns
-
30km: Exhibits the largest area of T-Td ≤ 4°C (~26,000 km² at peak), showing extensive and well-connected regions of high moisture content

Conclusion
Larger supercells maintain lower dew point depression values over broader areas and for longer periods. This enhanced moisture content and distribution contributes to their intensity and longevity, supporting stronger convective processes and precipitation development.