2024-2 Numerical Weather Prediction
SUPERCELL
Precipitation
As the size of the supercell increases, the potential for intense and sustained precipitation also rises. This is indicated by higher concentrations of QRAIN and QCLOUD, as well as a broader vertical extent of these factors within the storm.
Total Precipitation Accumulated on Surface
Overview
This section examines the total accumulated precipitation on the surface, which includes both convective (RAINC) and non-convective (RAINNC) precipitation. Larger supercells tend to produce broader areas of accumulated precipitation, while smaller supercells exhibit more concentrated regions of rainfall.
Analysis
Initial Observations
Larger supercells tend to cover a wider spatial area with accumulated precipitation. In the initial stages, both large and small supercells exhibit minimal precipitation, but as convection intensifies, larger supercells develop a more extensive precipitation field.


Supercell Size Comparison
Larger supercells continue to accumulate precipitation at a higher rate, reaching a sustained level of rainfall.
-
5km: Exhibits lower precipitation accumulation and stabilize quickly after
the initial phase of the event. -
10km: Displays greater accumulation, reaching a steady state shortly thereafter.
-
25km: Optimal for sustained precipitation generation, showing the highest accumulation.
-
30km: Less precipitation than 25km case, as their broader extent partiallydisperses internal dynamics, thereby reducing precipitation intensity.
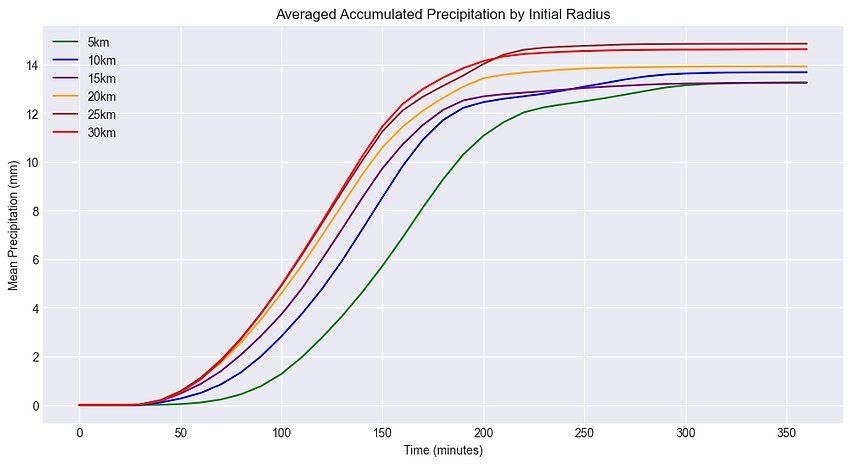
Conclusion
As the initial radius of the supercell increases, the average accumulated precipitation increases more rapidly and reaches higher values over time. This indicates that larger supercells tend to generate greater amounts of accumulated precipitation overall.
QCLOUD
Overview
QCloud (Cloud Water Mixing Ratio) is a measure of the cloud water content within a supercell, crucial for understanding precipitation processes. High QCloud values indicate a significant presence of cloud water, potentially leading to more intense precipitation.
Analysis


Supercell Size Comparison
Larger supercells exhibit higher Qcloud concentrations, indicating an enhanced potential for cloud formation and precipitation.
-
5km: Shows relatively low QCLOUD values with limited distribution.
-
10km: Displays an increase in QCLOUD concentration, indicating a higher likelihood of cloud formation and precipitation.
-
30km: Exhibits the highest QCLOUD concentrations over a broader area.

Conclusion
As the size of the supercell increases, the concentration and intensity of QCLOUD rise significantly. This enhanced concentration of rainwater mixing ratio suggests that larger supercells have a higher potential for sustained and intense rainfall within the storm structure.
QRAIN
Overview
QRAIN (Rain Water Mixing Ratio) represents the concentration of rainwater within a given volume of air, typically measured in kg/kg. Higher QRAIN values indicate a greater likelihood of rain and suggest the presence of substantial water content within the clouds.
Analysis

Supercell Size Comparison
The concentration and vertical extent of QRAIN increase with the size of the supercell.
-
5km: QRAIN is relatively low, indicating limited rainwater concentration and confined distribution.
-
10km: Moderate increase in QRAIN values, with slightly broader vertical distribution.
-
30km: Show the lowest QRAIN values among the supercell sizes, with a broad distribution indicating widespread.
Conclusion
Larger supercells show both higher QRAIN concentrations and more extensive vertical distributions, which correlate with an increased potential for intense and widespread precipitation. These results indicate that supercell size plays a critical role in determining the intensity and vertical reach of rainwater, with larger supercells likely contributing to more severe precipitation impacts over time.